Console
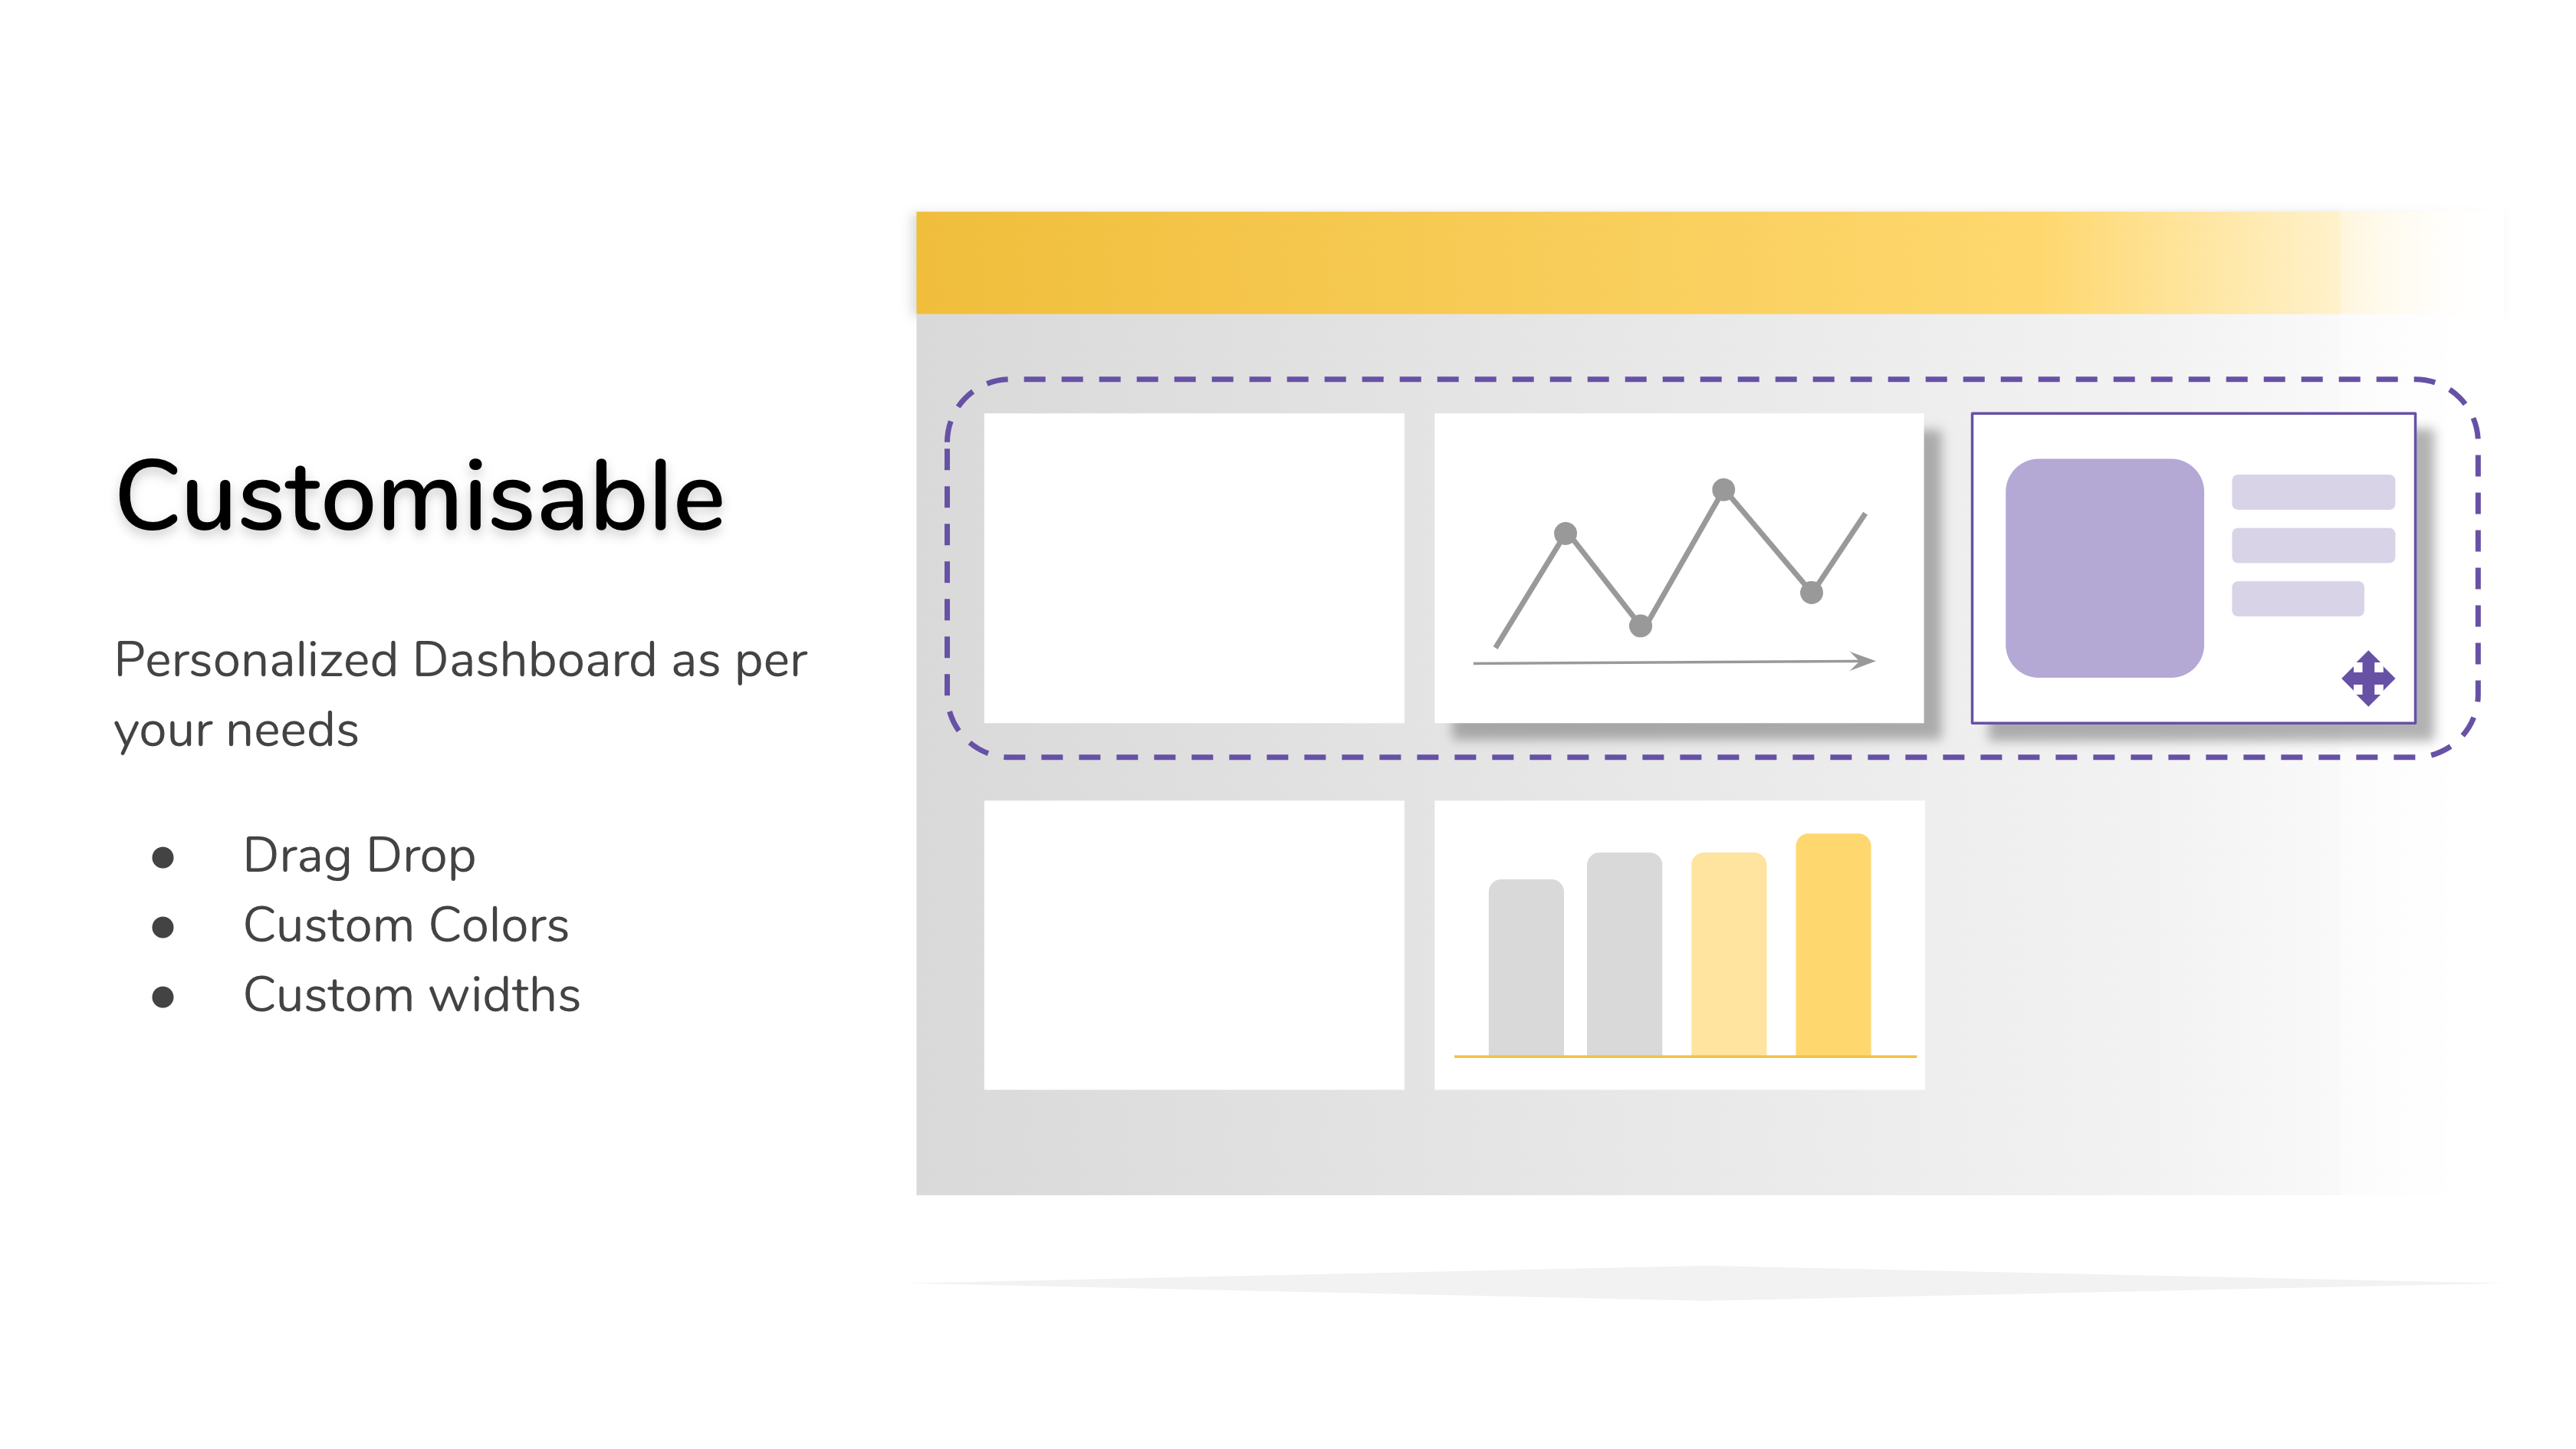
Peruse enterprise-wide data. Console for Strategic, Operational, Informational and Validation Dashboards. Flexible to fit your needs and design
Find Out MoreUnabridged Data At One Place
Collect, Customise, Consolidate, Collabarte
Executive dashboards give your organization’s leaders a real-time overview of your business in the form of graphs, charts, summaries and other information reports. They allow your company’s executives to make smarter, faster and better decisions.
Comprehensive
Single Point of access for all Engineering Data across multiple applications and domains.
Consolidated
Consolidate information across your organization.
Validate
Analyze and Validate the Data from EPCs
Imports & Exports
Import data from Files and Export data to different formats like excel, PDF, CSV
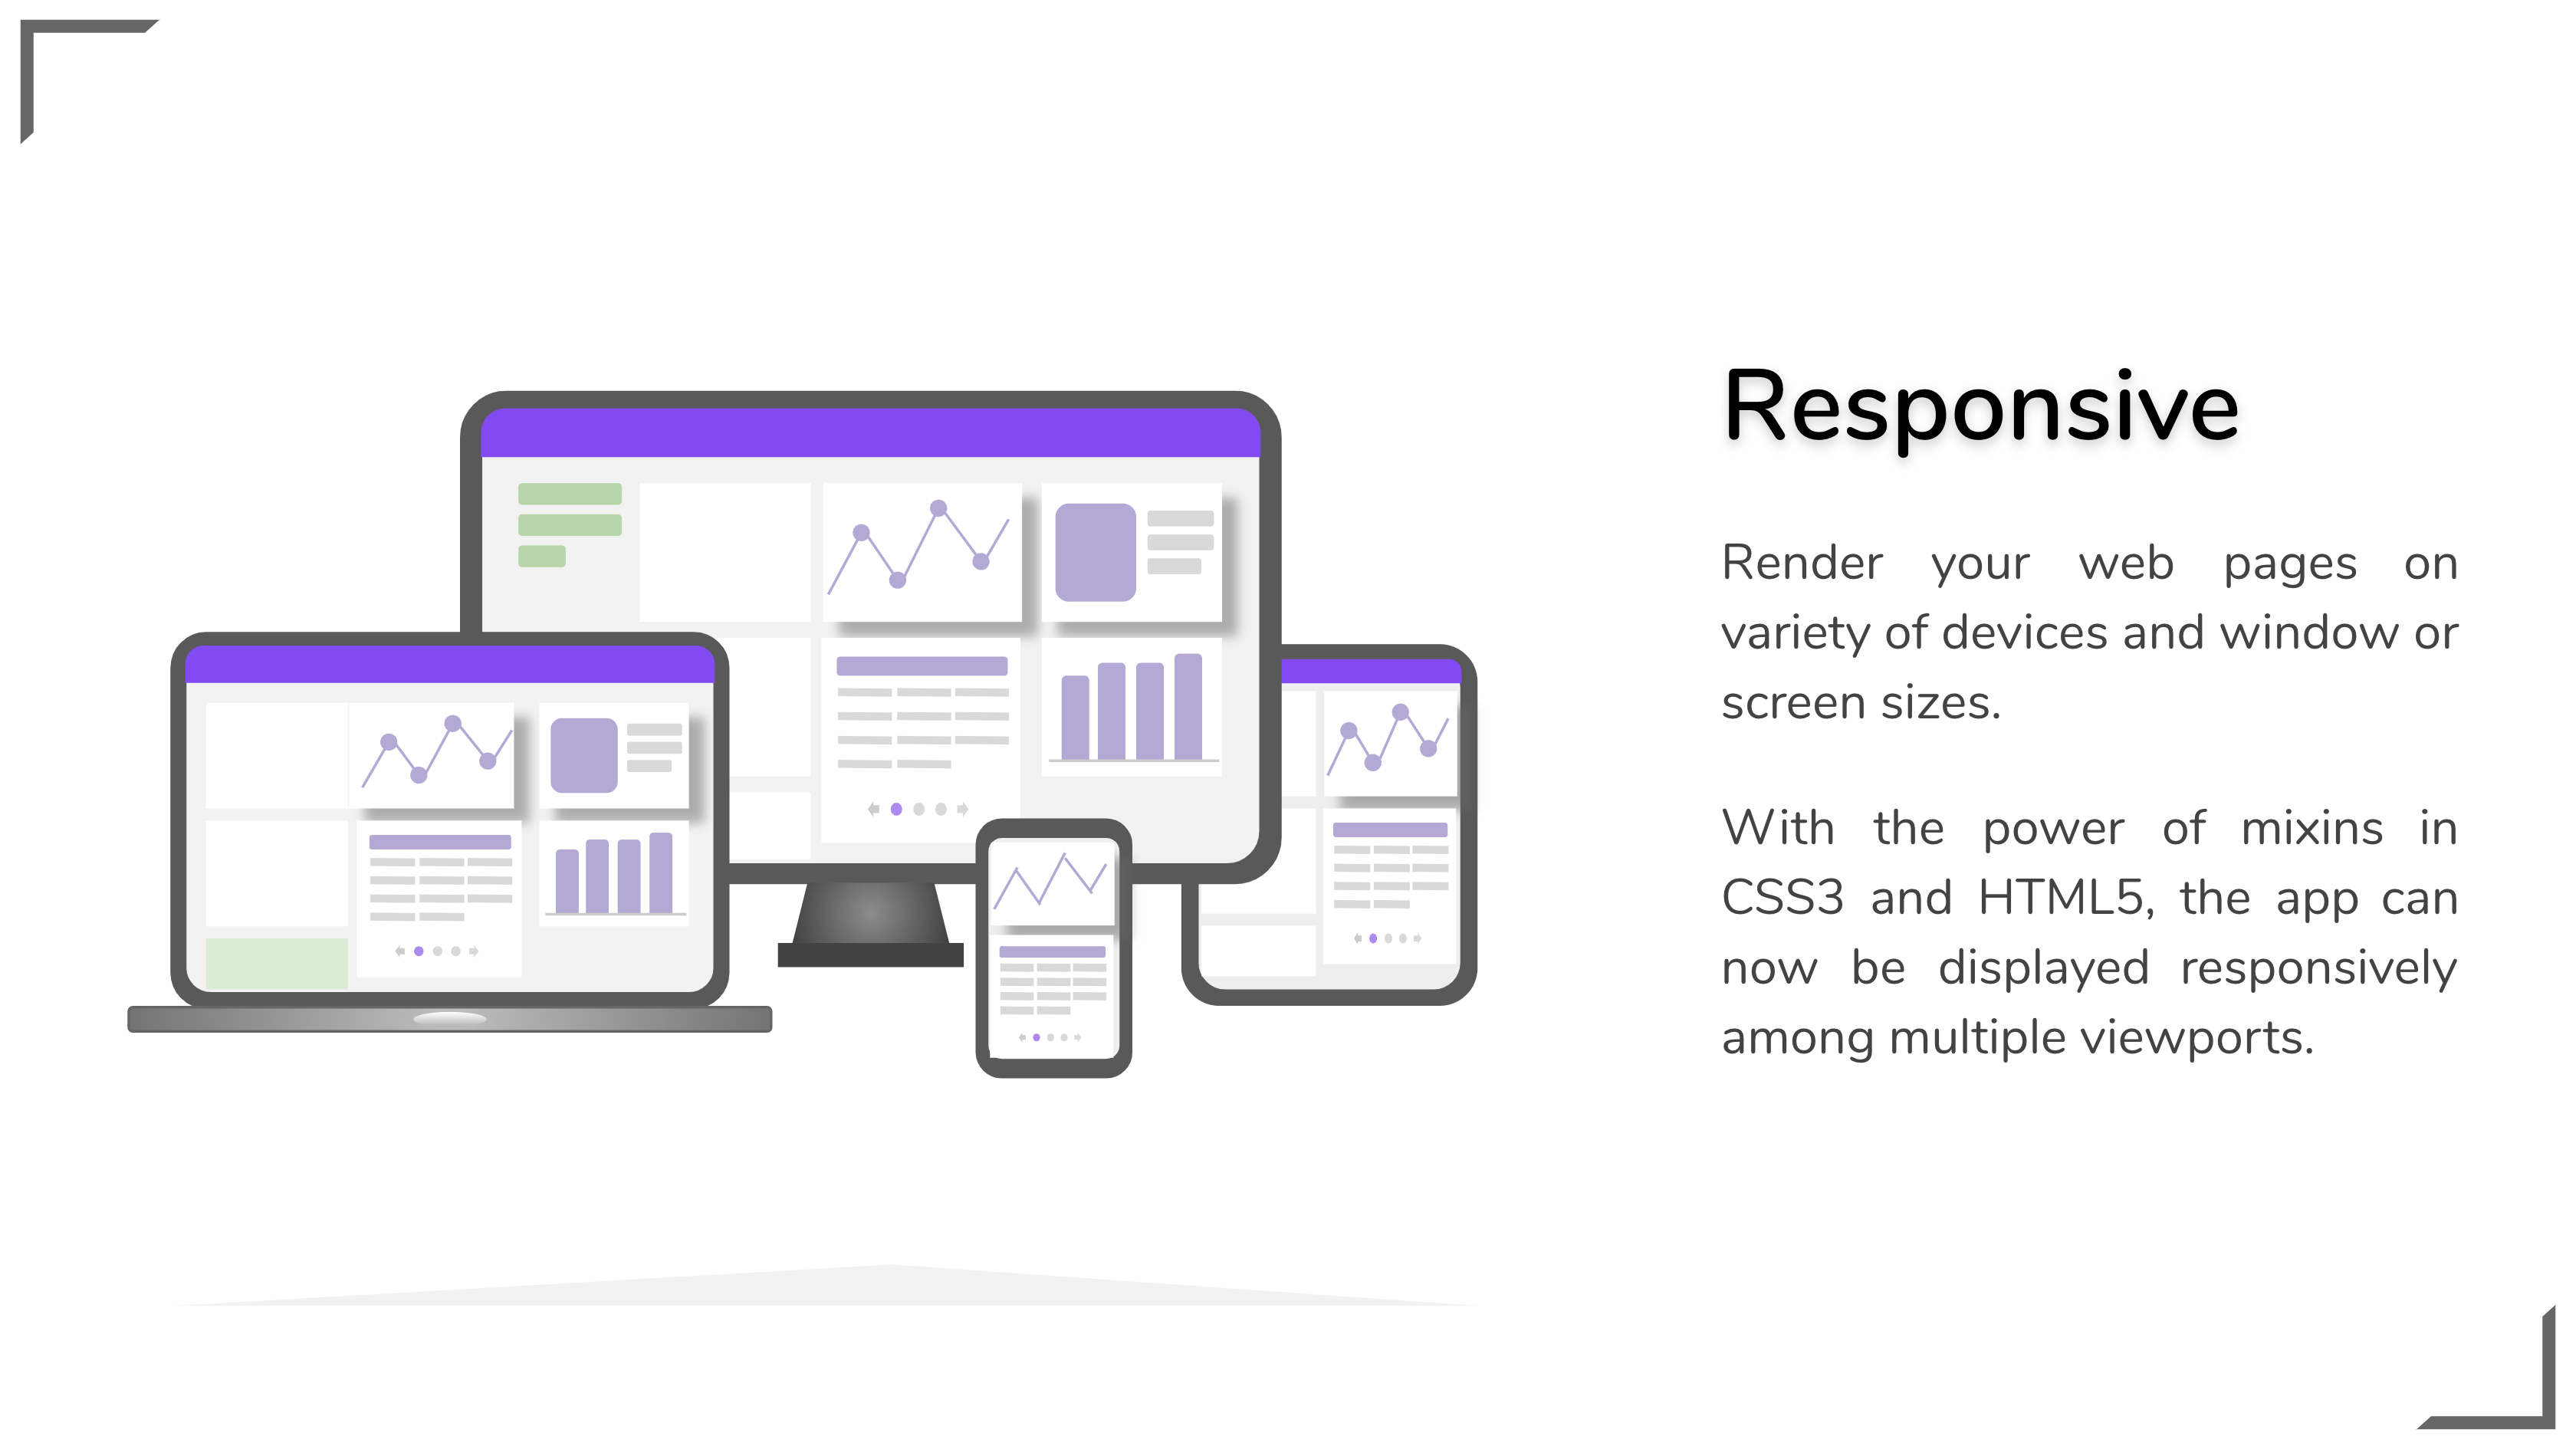
Portable
Serving functionalities through API provides the application the ability to render from wide range of modern UI devices.
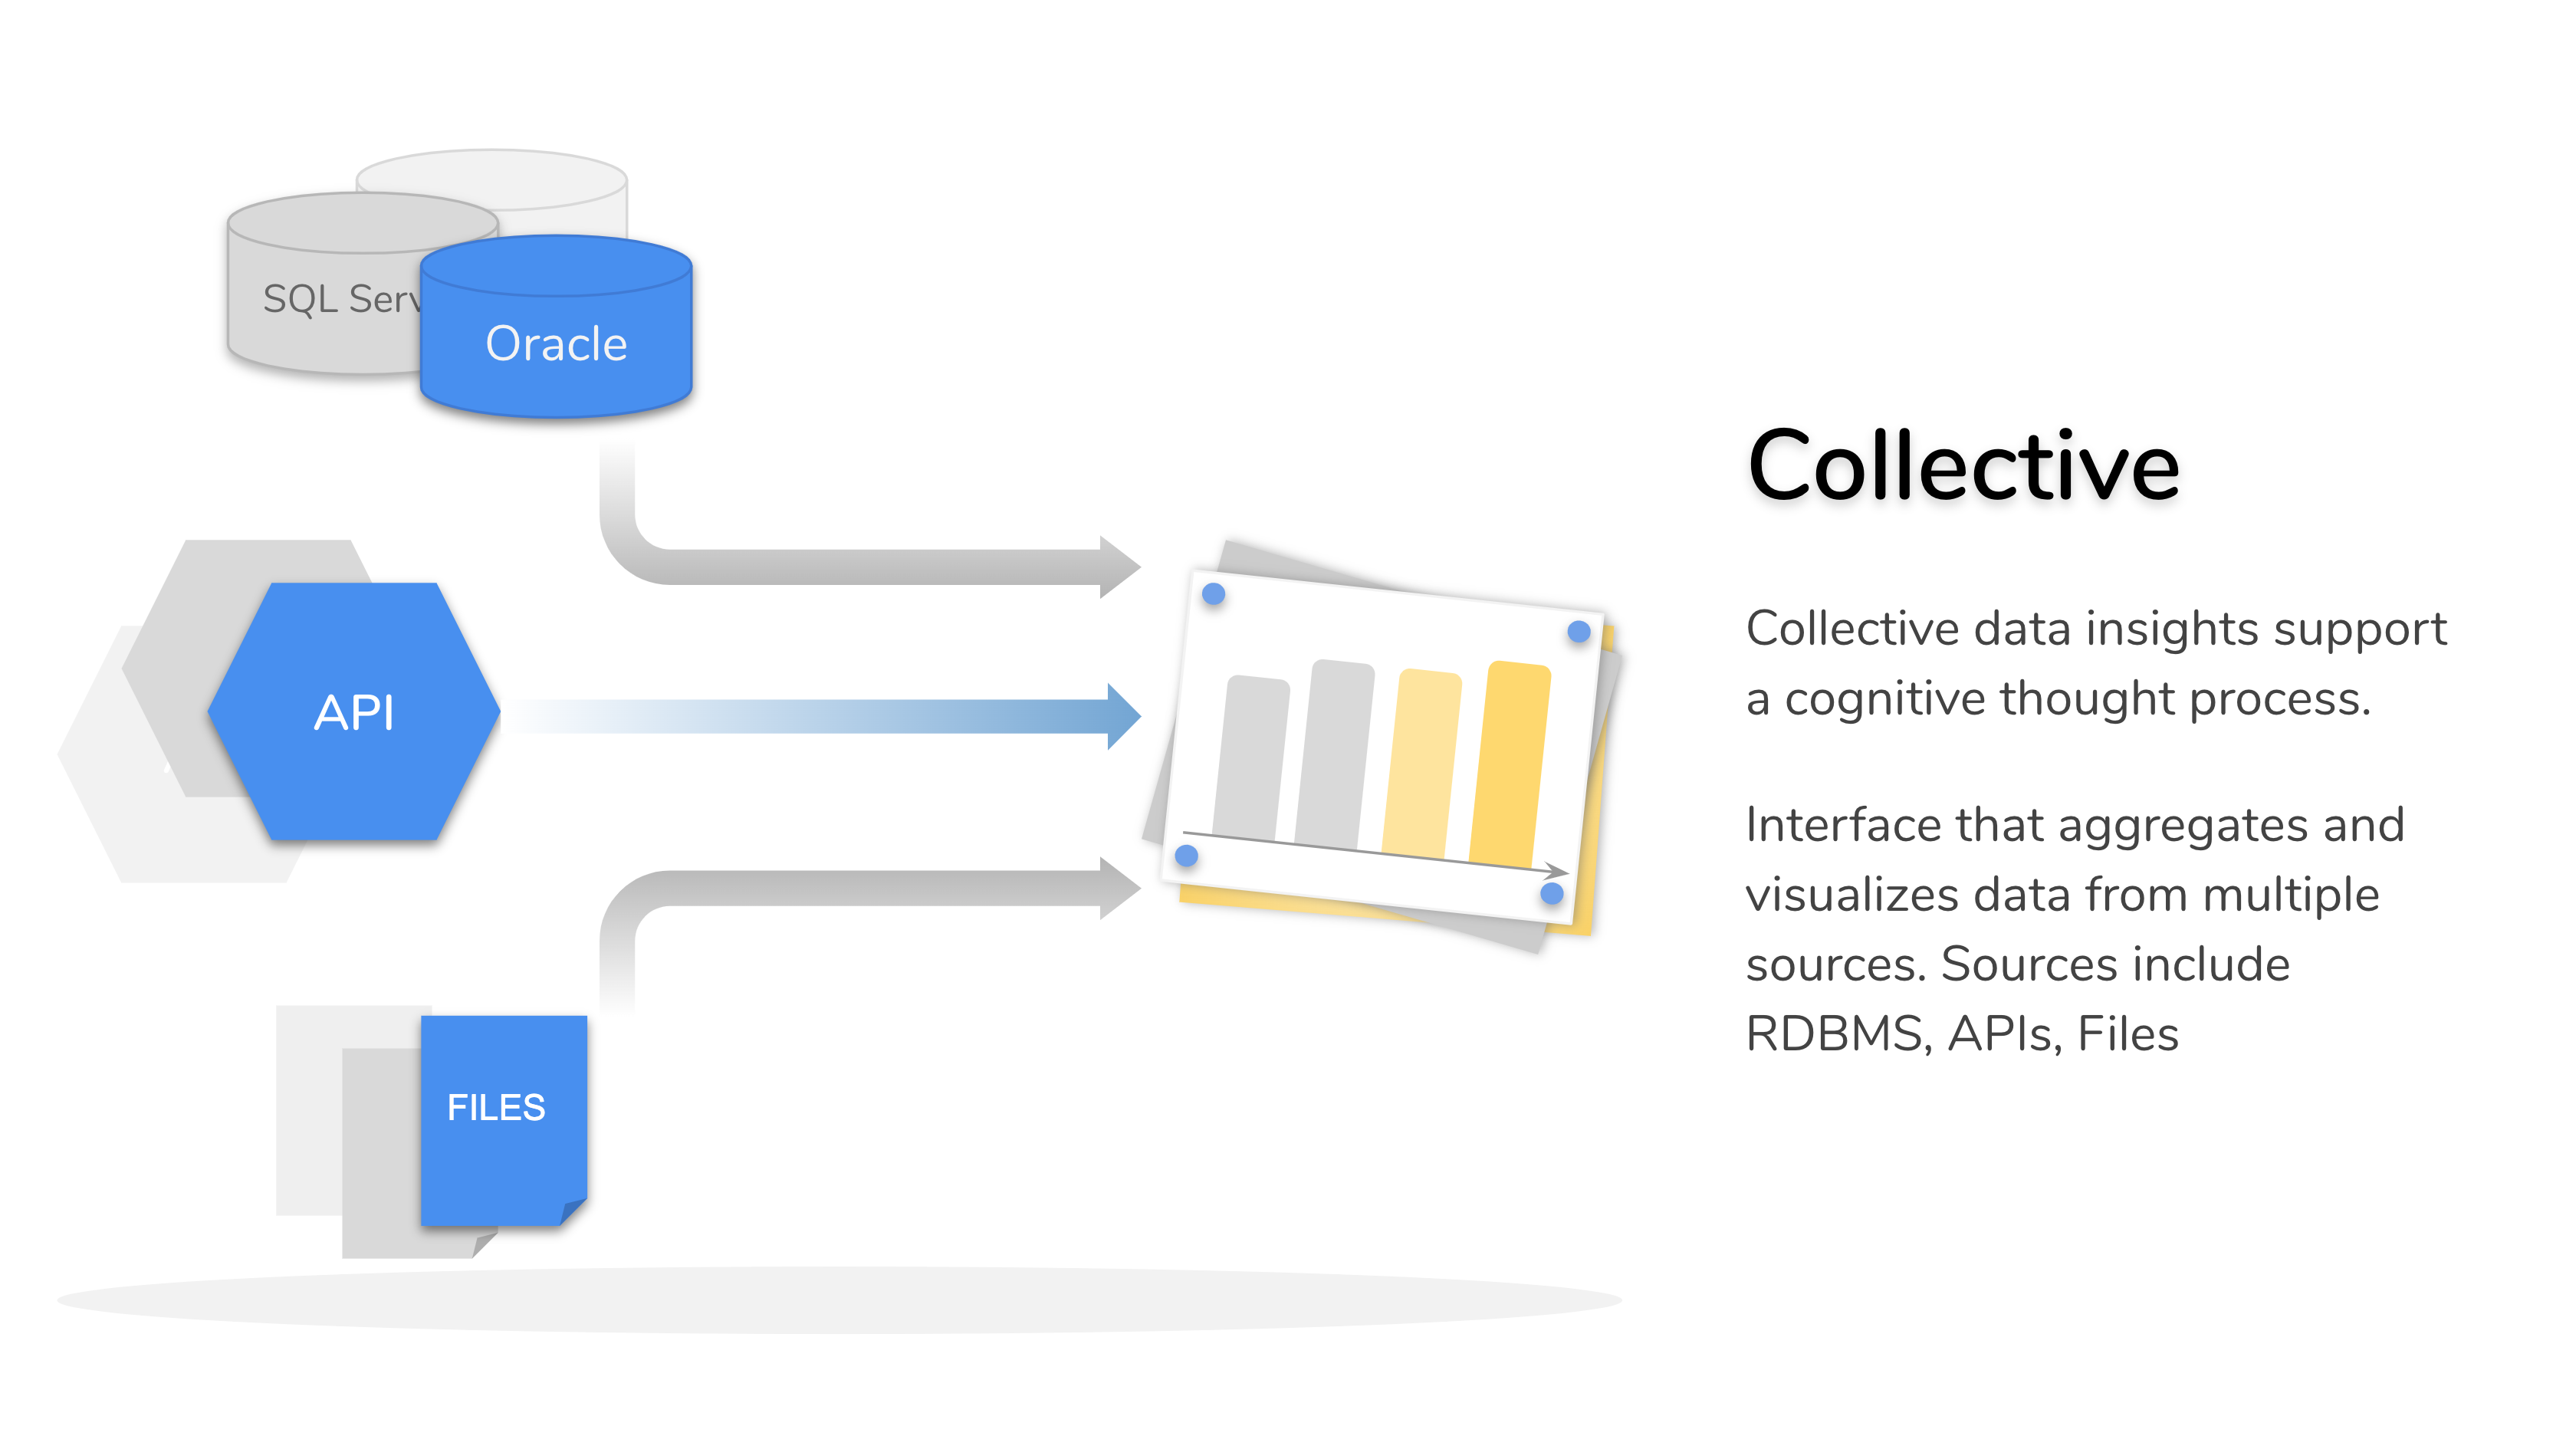
Heterogenous
Interface that aggregates and visualizes data from multiple sources. Sources include RDBMS, APIs, Files
KEY FEATURES

Use Cases
KPI
A Key Performance Indicator (KPI) is a measurable value that demonstrates how effectively a company is achieving key business objectives. Organizations use KPIs to evaluate their success at reaching targets.

Data Validation
Data Validation provides graphical representation to evaluate the reliability of Vendor or Contractor or different departments data based on the validation rules. Allow business users to quickly review the inconsistencies in the source data.

Data Analysis
Data analysis is a process of inspecting, cleansing, transforming and modeling data with the goal of discovering useful information, arriving at conclusions and supporting decision-making.

We Are Ready To Serve Our Product
Improve Efficiency And Provide Better Experience By Our IT Solutions!
Trusted by the world’s best organisations, it has been delivering smiles to hundreds of data analysts, users, and business users. One place to access organisation wide data.
- Running succesfully in ADNOC Offshore
- Machine Learning included in RoadMap
- Free product upgrades and online support when under maintenance
Request A Quote
Our deep pool of certified engineers and IT staff are ready to help you to keep your IT business safe & ensure high availability.